React项目搭建与Echars工具使用的方法是什么
一、React项目快速搭建
1、新建文件夹
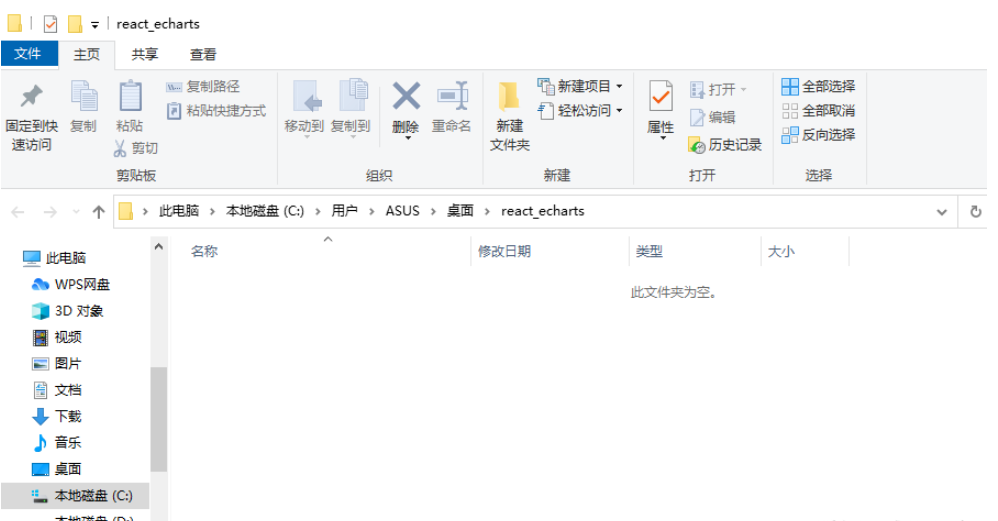
2、直接在对应目录输入 cmd ,打开终端
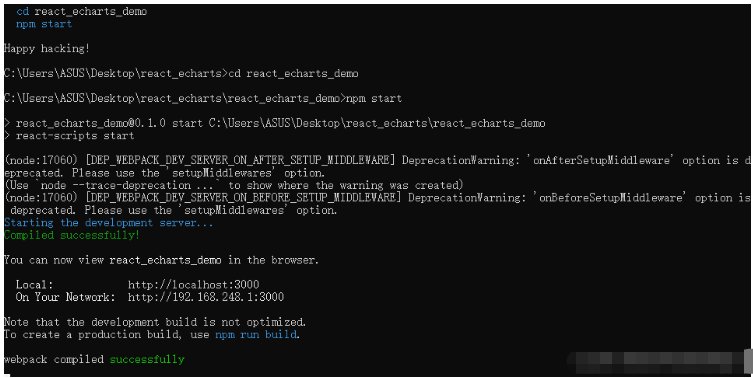
3、执行指令完成React应用建立
npx create-react-app react_echarts_demo

cd react_echarts_demo
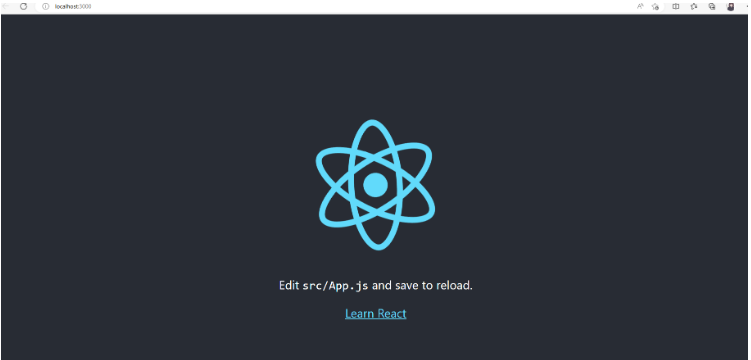
npm start
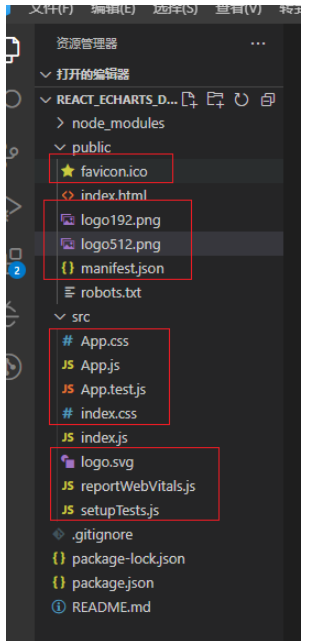
二、React项目结构和分析
终端对应目录下输入 code . 打开 vs code
1、删除多于文件,使得结构清晰
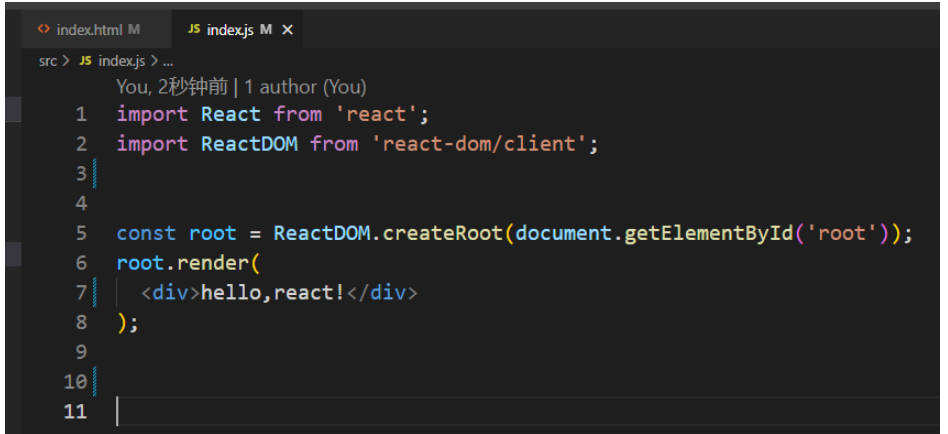
2、删除剩余文件中多于的引用内容

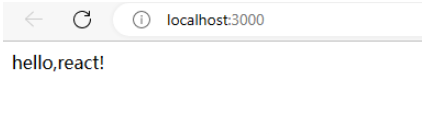
3、使用vs code打开终端,运行项目

三、Echarts工具使用
1、npm安装依赖
npm install echarts --save
npm install --save echarts-for-react
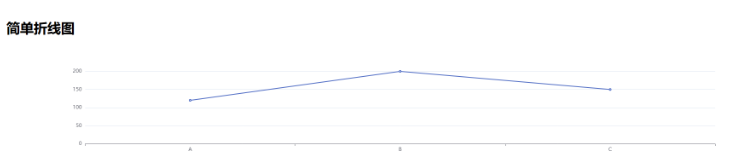
2、简单折线图
使用 echarts-for-react
引用代码
import React from 'react';
import ReactDOM from 'react-dom/client';
import LineCharts from './LineCharts';
const root = ReactDOM.createRoot(document.getElementById('root'));
root.render(
简单折线图
组件代码
import React, {Component} from 'react';
import ReactECharts from 'echarts-for-react';
// 在此组件中绘制一个简单的折线图
export default class LineCharts extends Component{
// 返回折线图的配置对象
option = {
xAxis: {
type: 'category',
data: ['A', 'B', 'C']
},
yAxis: {
type: 'value'
},
series: [
{
data: [120, 200, 150],
type: 'line'
}
]
};
render() {
return(
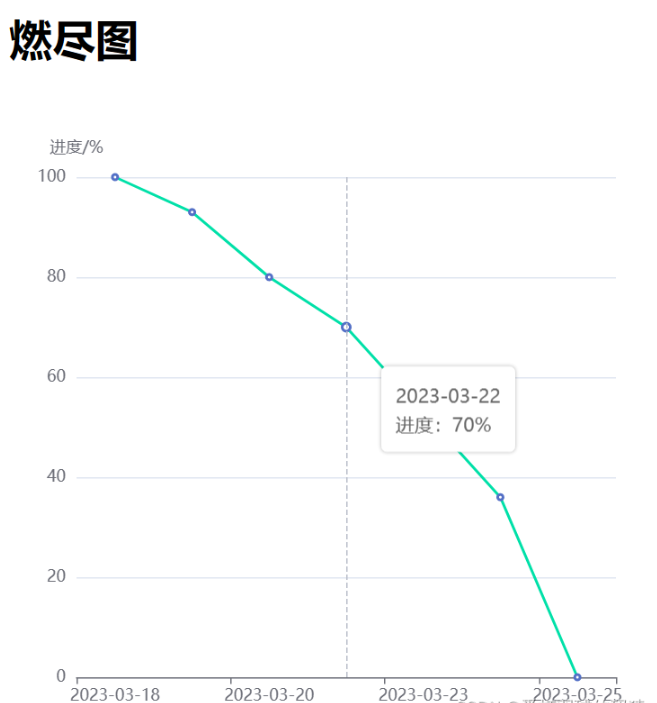
3、燃尽图 使用echarts
代码如下:
index.js
import React from 'react';
import ReactDOM from 'react-dom/client';
import LineEChartsDemo from './LineEchartsDemo';
const root = ReactDOM.createRoot(document.getElementById('root'));
root.render(
燃尽图
LineEchartsDemo.jsx
import React, { Component } from 'react'
import LineECharts from './LineECharts'
class LineEchartsDemo extends Component{
constructor(props) {
super(props)
this.state = {
data: {
x: ['2023-03-18', '2023-03-19', '2023-03-20', '2023-03-22', '2023-03-23', '2023-03-24', '2023-03-25'],
y: [100, 93, 80, 70, 53, 36, 0]
}
}
}
componentDidMount() { }
render() {
return (LineECharts.jsx
import React, {Component} from 'react';

import * as echarts from 'echarts';


export default class LineECharts  extends Component{
  constructor(props) {
    super(props)
    this.state = {
    }
  }

  // 挂载完成之后,因为React初始化echarts时长宽可能会获取到顶层,所以延迟200去生成,不影响视觉效果
  componentDidMount() {
    setTimeout(() => {
      this.initEchart(this.props.data)
    }, 200)
  }

  // 更新props以后调用
  componentWillReceiveProps(newProps) {
    this.initEchart(newProps.data)
  }

  initEchart = (data) => {
    let myEcharts = echarts.init(this.echartsBox)
    let option = {

      title: {
        text: this.props.title || '',
        left: 'center',
        top: '0'
      },
      tooltip: {
        show: true,
        trigger: 'axis',

        formatter: '{b}
进度:{c}%',
        extraCssText: 'box-shadow: 0 0 3px rgba(0, 0, 0, 0.3);'
      },
      xAxis: {
        type: 'category',
        data: data.x,
      },
      yAxis: {
        name: this.props.yname,
        nameGap: 15,
        position: 'left',
        axisLabel: {
          formatter: '{value}'
        }
      },
      series: [{
        name: '汇总',
        type: 'line',
        data: data.y,
        smooth: false,
        lineStyle: {
          color: '#00CC99',
          width: 2
        },

      }]
    }
    myEcharts.setOption(option)
    myEcharts.on('finished', () => {
      myEcharts.resize()
    })
  }

  render() {
    return (
       { this.echartsBox = c }} style={{ width: '500px', height: '500px' }} />
    )
  }
}
4、不同的图形,Echarts官网找对应Option内容复制即可
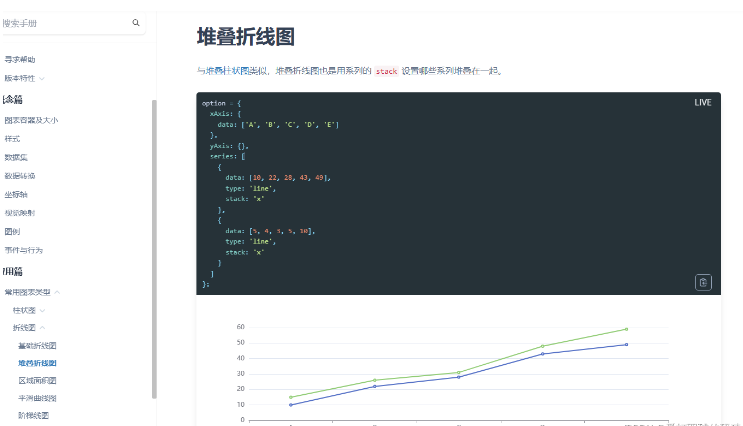
option = {
  xAxis: {
    data: ['A', 'B', 'C', 'D', 'E']
  },
  yAxis: {},
  series: [
    {
      data: [10, 22, 28, 43, 49],
      type: 'line',
      stack: 'x'
    },
    {
      data: [5, 4, 3, 5, 10],
      type: 'line',
      stack: 'x'
    }
  ]
};